
This report provides a brief analysis of the magnetic planning boards sub-market in the Amazon US market, aiming to offer valuable information for cross-border industry stakeholders of Amazon from aspects such as market trends, product analysis recommendations, and consumer insights.
Contents
- I Introduction
- II Marketing Analysis
- III Product Research
- IV Competitive Analysis
- V Feasibility suggestion
I. Introduction
Magnetic memo board, a planning board that adheres to places like refrigerators and kitchens, assisting in managing schedules.
Life cannot wait for others to arrange it, and families need a sense of ceremony. For important moments such as birthdays, wedding anniversaries, and Valentine's Day, to avoid forgetting, the most practical method is to use a memo board to jot down and create a schedule checklist, ensuring proper time planning.
There are many benefits to using this tool. It not only helps you understand how to effectively utilize time but also allows you to accurately know when to complete specific tasks, making your personal life more organized and your family activities more coordinated.
Planning Boards has a relatively small market size, with annual sales of approximately $16 million. New product quantity accounts for 39% of sales, indicating that consumers are receptive to new products. However, the low product threshold and high PPC bidding pose certain challenges, and sellers need to consider their own situation before deciding whether it is suitable to enter the market.
Strengths | Weaknesses |
39% of the TOP100 products are new, indicating high acceptance of new products by consumers. The product return rate is low, at only 4.8%, making after-sales costs controllable. Although the market growth rate has slowed down, it is still expected to have an annual growth rate of over 20% in 2023. If monthly sales are less than 100, there is a chance to enter BSR. | Most of the products have A+ content and videos, with high requirements for images and videos. There are few options for logistics, with a bias towards sea freight, resulting in long delivery times and a high possibility of stock shortages. Some top brands have relatively low pricing, so new sellers entering the market don't have much advantage in terms of price. |
Opportunities | Threats |
The head brand layout is relatively simple, and consumers do not have a strong brand awareness. The products are relatively ordinary, and product research and development can be done in terms of style, design, materials, or intelligent functions. | PPC bidding is high, and it is difficult to control marketing and promotion expenses. Sales may vary significantly in different months due to the impact of the back-to-school season. With an increasing number of products in the category, competition may become more intense. |
II. Marketing Analysis
The basic market situation
The average monthly sales of the top listings are 3,517 units, while the average monthly sales of new products are only 900 units. The overall market demand is relatively low and niche.
New products account for 39% of the total, and sales account for 33.3%. To some extent, new products are more likely to enter the TOP100 list, and the average price of new products, which is $17.37, has slightly increased compared to the TOP100 average price of $16.79. There is no obvious trend of low prices for new products.
All Listing(in 6 months) | |
Total items | 1,594 |
Return rate | 4.8% |
Search for purchasing ratio | 3.7‰ |
Top 10 Listing | |
Monthly sale | 3,517 |
Monopoly level | 3 |
Average monthly revenue | $56,828 |
New Listing (Launched within 6 months in TOP100) | |
Number/Proportion of New Products | 39(39%) |
Average monthly sale | 900 |
Sales proportion | 33.3% |
Average monthly revenue | $15,826 |
Average price | $17.37 |
Listing Sample(TOP100) | |
Basic Information | Products: 100; Brands: 85; Sellers: 49 |
Sellers | FBA: 97%; AMZ: 3%; FBM: 0% |
Monthly Sale | 105,326 |
Average monthly sale | 1,053 |
Monthly Revenue | $17,692 |
Average Price | $16.79 |
Average Reviews | 1,552 |
Average Ratings | 4.5 |
Average gross profit margin | 50% |
Listing Sample(TOP100) | |
Average Seller Number | 1.30 |
A+ proportion | 84% |
Product concentration | 33% |
Brands concentration | 45% |
Seller concentration | 68% |
Seller's location | China:78% ; USA:15% |
Category keywords Google Trends
Keywords include:
- planning board
- fridge calendar
- chore chart
- dry erase calendar
- magnetic calendar for refrigerator

The yellow represents the planning board, and the blue represents the fridge calendar
Category Keyword ABA Ranking Trend
According to the ABA ranking trend based on category keywords, it will reach its peak in August and will be relatively low in ranking in November and December. The keyword ranking fluctuates significantly, but overall, it shows an upward fluctuation trend.
The ABA ranking for the keyword "magnetic calendar for refrigerator" has been rising rapidly in the past year, which may be related to an increase in consumer demand for this type of product.

BSR sales and competitive situation
Looking at monthly sales, there is a cyclical small peak from July to September each year, and the increase in sales may be related to the back-to-school season.
Looking at the entire year, the overall annual growth rates from 2020 to 2022 are 86.69%, 112.74%, and -2.06%, respectively. After several years of rapid growth in the US market, the growth rate of magnetic whiteboards has begun to slow down, and the annual growth rate for 2023 is expected to be 22.92%.
In terms of the number of category products, it has increased from around 400 in 2021 to around 1200 in 2023, and many sellers are still entering the market.


Summary
In summary, the market size of Amazon's magnetic memo board on the US site is not very large in 2022, with an annual sales volume of around 950,000 and sales revenue of around $16.43 million. After several years of rapid growth, there is a gradual slowdown trend, and the annual growth rate is expected to be 22.92% in 2023, with sales expected to reach 1.17 million units in 2023.
The proportion of new products in this segment market is around 39%, which is relatively high, meaning that new products have a great opportunity to enter the TOP100. Among them, the market share and proportion of new products in the memo board set are the highest, and from the actual product data, there may be good prospects.
III. Product Research
Planning Boards Style Analysis:
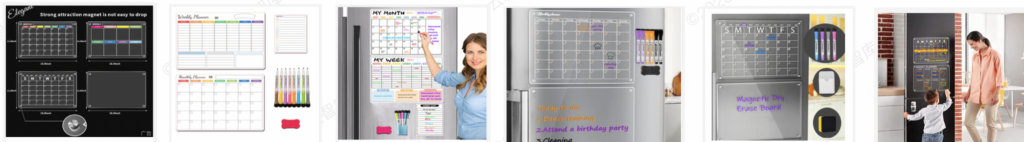
- In terms of product combinations, they usually consist of monthly planners, weekly planners, memo lists, and other accessories such as marker pens and erasers.
- In terms of product materials, they are usually made of acrylic, polyester fiber, paper, PET, and other materials.
- In terms of product colors, the colors are mainly transparent, white (with black or colored accents), with a few adding other colors.
- In terms of user groups, the usual users are family members, children, husbands, daughters, mothers, and other roles.
Product Operations Analysis
The sales trend chart shows that the sales of the notepad set started to rise in the second half of 2022 and the upward trend in 2023 is becoming steeper, possibly related to global economic recovery.

The price trend chart shows that the price of the notepad set experienced a significant increase during the back-to-school season in 2022, rising from $10 to $20, a 100% increase. It remained relatively stable for the following year.

Price Analysis
Product price distribution: Most of the products are distributed in the price range of $0-$24.99, with only 2 products priced above $25. Although the $0-$9.99 range accounts for 10.2% of the total, the prices are too low, resulting in less substantial profit margins.
Percentage of new product price ranges: New products are mainly concentrated in the price range of $10-$24.99, with a higher proportion of new products falling within the $15-$19.99 range. Additionally, the average sales volume per ASIN is also the highest within this price range, making it a suitable choice for pricing.
Price | ASIN | New Asin | Monthly Sale rate | Average Sale of Single Asin |
$0-$9.99 | 10.2% | 0.0% | 11.7% | 2,111 |
$10-$14.99 | 24.5% | 10.2% | 31.2% | 9,768 |
$15-$19.99 | 51.0% | 18.4% | 34.0% | 23,418 |
$20-$24.99 | 10.2% | 4.1% | 11.6% | 4,153 |
$25以上 | 4.1% | 0.0% | 11.6% | 592 |
Brands Analysis
In the performance of the notepad suite brands, there are 5 brands with multiple ASINs entering the TOP100, while the other brands have single ASINs entering. The top 11 brands have monthly sales of over 1000 units, but the market size is relatively small.
Apart from the AITEE brand, which accounts for more than 10% of the sales, the sales distribution of other brands is balanced, indicating no significant monopoly effect among the brands. Although the sales volume is not large, each brand can still get a share of the market.
Brands | ASIN | Monthly Sale | Rate | Monthly Revenue | Rate |
AITEE | 3 | 8,288 | 20.70% | $171,736 | 24.90% |
JJPRO | 4 | 3,938 | 9.83% | $69,875 | 10.13% |
VOGHJA | 1 | 2,539 | 6.34% | $45,575 | 6.61% |
Clever Clean | 2 | 2,228 | 5.56% | $34,792 | 5.04% |
Tmtamye | 1 | 2,120 | 5.29% | $25,419 | 3.69% |
CSTKPFV | 2 | 1,919 | 4.79% | $36,449 | 5.28% |
Lortarl | 1 | 1,797 | - End - 詳細を読む AI-Driven Global Brand Business Growth VOC AIは、センチメント分析(感情分析)とAI/ChatGPT技術を活用することで売り手(ブランド)が市場チャンスを獲得できます。ビジネスの成長を見守り、より満足のいく顧客体験を提供する支援をいたします。 本サイトはCookieを使用しています。 シュレックスVOCは、ウェブサイトを正常に機能させるためにクッキーを使用し、お客様の嗜好、デバイス、過去の行動に関する情報を保存します。このデータは集計または統計的なものであり、お客様個人を特定することはできません。当社が使用するクッキーの詳細および同意の撤回方法については、当社の プライバシー ポリシー. Googleアナリティクスは、当ウェブサイトのユーザーエクスペリエンス向上のために使用しています。当サイトを利用し続けることで、Google AnalyticsによるCookieの使用とデータ収集に同意したものとみなされます。 これらのクッキーを受け入れてもよろしいですか? |

